
How MIMOSI Health helps combat COVID-19 #1: Italy has the coronavirus in check, while the US and Spain struggle. We need a COVID Management solution now.
The US, Italy and Spain had the highest number of coronavirus cases in March 2020, but the situation has changed dramatically. Italy has flattened the curve and maintains fewer than 600 new cases every day. Spain is facing down a possible second wave, while the US is still seeing a surge in new infections. The difference in new cases is a result of the COVID management in each country.

United States
The United States reported its first case of coronavirus on January 22 and since then, the number of cases has skyrocketed to over 5.2 million (Source: John Hopkins University). The US accounts for the highest number of coronavirus cases globally.

Source: Statista
Missed management, missed opportunities
On February 26, the US recorded the first case of suspected local transmission in a patient with no travel history to an outbreak area, or contact with anyone diagnosed with the virus. By the end of February, confirmed cases appeared in nine states across the US, but widespread testing was not approved until March 3 (Gamio, L., The New York Times). The delayed restrictions on travel, untimely broad testing, and lack of real-time tracing made the situation in the US more serious.
Spain
Spain lifted its state of emergency in late June after the country had seen a significant reduction in COVID-19 infection. However, experts warn the second wave has started, noting a surge in cases from mid-July of more than 3,000 new cases per day.

Source: Statista
Unreliable data
According to The New York Times, Spanish authorities have changed their data collection method several times since March, creating confusion over the actual number of confirmed cases.

Data source: The New York Times
The change in data collection accounted for a drop from 220,000 to just over 200,000 cases in April and a decrease of 2,000 deaths in May. Additionally, the data on hospitalized and ICU patients had been tallied inconsistently - some areas reported the people admitted daily while the others gave the total admissions to date (Llaneras K., El Pais). A transparent database is necessary to keep up-to-date the control systems and provide sustainable evidence for detection of risk during the second wave.
Italy
From a state of panic and nearly collapse of more than 5000 new cases per day in March, Italy has turned around its coronavirus calamity to under 600 new infections, and daily hover around zero.
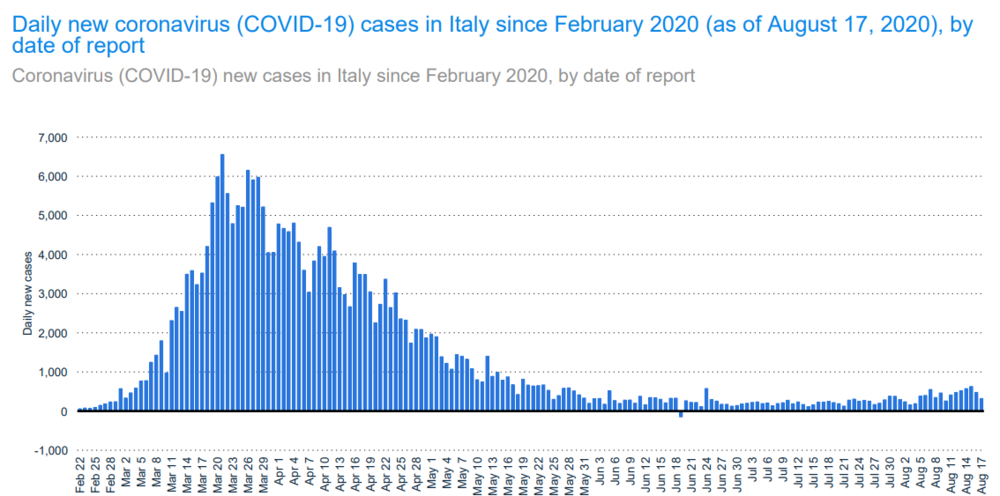
Source: Statista
According to The New York Times, there has been a collaboration between healthcare providers, lab technicians and the government in managing the COVID-19 situation: "local doctors, hospitals and health officials collect more than 20 indicators on the virus daily and send them to regional authorities, who then forward them to the National Institute of Health." Based on results from the weekly analysis, appropriate policy decisions will be made. The difference in COVID-19 management brings a difference in the volume of virus circulating in society. Yet there is a long way to combat COVID-19, control effort should be continuously refined.
MIMOSI Health is a collaborative platform that fills a critical gap in existing public health systems. It provides a trusted, immutable record of key transactions and metrics across multiple stakeholders in community-based healthcare. MIMOSI Health represents an opportunity for a country to record and collect suspected and confirmed case data from multiple stakeholders using a uniform, one-stop-shop platform.
To request a demo, click here.
Disclaimer: The scope of this article is limited within data management and is exempt from other political points of view.
References
Schuchat, A. (2020, May 07). Public Health Response to the Initiation and Spread of Pandemic COVID-19 in the United States, February 24–April 21, 2020. Retrieved August 17, 2020, from https://www.cdc.gov/mmwr/volumes/69/wr/mm6918e2.htm?s_cid=mm6918e2_w
Gamio, L. (March 21, 2020) et al. Watch How the Coronavirus Spread Across the United States. The New York Times. Retrieved from https://www.nytimes.com/interactive/2020/03/21/us/coronavirus-us-cases-spread.html
Schumaker, E. (July 28, 2020). Timeline: How coronavirus got started. ABC News. Retrieved from https://abcnews.go.com/Health/timeline-coronavirus-started/story?id=69435165
Derrick, T. (August 6, 2020). A Timeline of the Coronavirus Pandemic. The New York Times. Retrieved from https://www.nytimes.com/article/coronavirus-timeline.html
Various authors (Updated August 17, 2020). Spain Coronavirus Map and Case Count. The New York Times. Retrieved from https://www.nytimes.com/interactive/2020/world/europe/spain-coronavirus-cases.html
Raphael, M. (July 23, 2020). Counting Bodies and Pointing Fingers as Spain Tallies Coronavirus Dead. The New York Times. Retrieved from https://www.nytimes.com/2020/04/16/world/europe/coronoavirus-spain-death-toll.html
Llaneras, K. (Jun 23, 2020). The problems Spain’s outdated data methods have caused during a 21st-century pandemic. El Pais. Retrieved from https://english.elpais.com/society/2020-06-24/the-problems-spains-outdated-data-methods-have-caused-during-a-21st-century-pandemic.html
Horowitz, J. (August 18, 2020). How Italy Turned Around Its Coronavirus Calamity. The New York Times. Retrieved from https://www.nytimes.com/2020/07/31/world/europe/italy-coronavirus-reopening.html
Various authors (Updated August 17, 2020). Italy Coronavirus Map and Case Count. The New York Times. Retrieved from https://www.nytimes.com/interactive/2020/world/europe/italy-coronavirus-cases.html